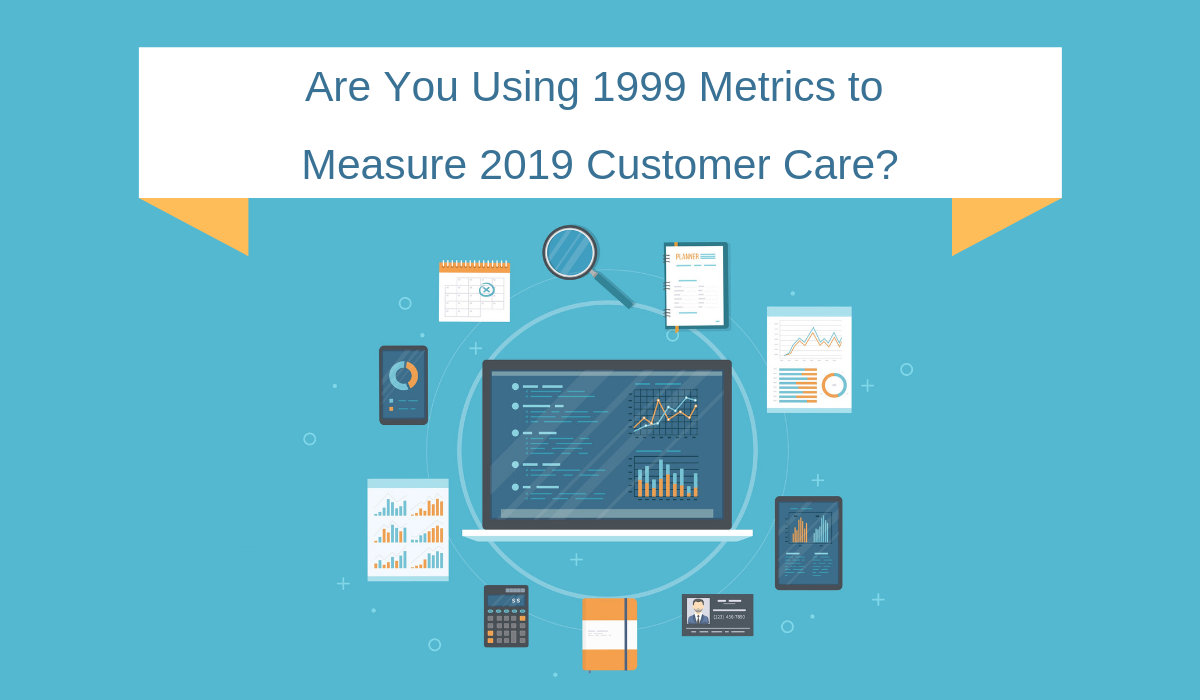
Are You Using 1999 Metrics to Measure 2019 Customer Care?
It’s 2019, which means contact center metrics from 1999 are almost old enough for their first legal beer (and already knocking them back in Canada.) Those metrics were born in an era when customer service was a race, where whoever got to the finish line first (i.e. off the phone) – upsetting the least number of hurdles, extra points for a graceful gait – was the champion, the most successful, the most likely to win “customer service agent of the year.”
TL;DR: Consumer expectations have evolved, which means using metrics from 1999 are no longer relevant. Data is critical for measuring customer care, but how you use that data to improve your CX is the key to success.
Today’s consumers and their shifting expectations have turned that perspective on its head. Instead, we live in a customer-centric world, where metrics like Average Speed of Answer (ASA), Average Handle Time (AHT), and First Call Resolution (FCR) are, by themselves, short-sighted and more focused on controlling costs instead of enhancing the experience. That said, the contact center accumulates millions of data points every single day. How do we use that data to improve the customer experience?
p.s. Our Contact Center Buyer’s Guide is now available! Grab your free copy here.
Fighting the Cost Center Mindset
We get it; earning executive buy-in on the decision to outsource your contact center usually includes a discussion about ROI. But calculating how the costs of your customer service solution make an impact on your bottom line can be complicated. For example, at first glance, an hour-long phone call with a customer that doesn’t result in first call resolution or a sale appears to be a high-cost, low-efficiency interaction.
What you may not initially see is how that hour inspires the customer’s lifetime loyalty and widespread promotion and advocacy, converting other customers on top of increasing their own spend. If that call was cut off at two or three minutes in the name of low AHT, an important opportunity to provide exceptional customer experience would have been lost.
Though hour-long calls are extraordinarily rare (though still nothing compared to the Zappos record customer-service call of 10 hours, 43 minutes!), this example holds its integrity even when scaled down to mere minutes and seconds. The point is, while data that describes an agent’s efficiency has its place (no one wants to be kept on hold unnecessarily or sit through minutes of pointless back-and-forth with a less-than-stellar agent) these metrics, taken alone, do little more than tell us to work as fast as possible to disengage from the customer.
Even if we are committed to delivering an exceptional customer experience, the fact is that many businesses turn to these metrics by default when making an outsourcing decision. Changing this approach and perspective is the first step in becoming a brand that your customers love. (For the same reason, we also believe that contact center pricing should never be your first question in the quest to outsource). But where do we start?
One Metric to Rule Them All
What one metric best reflects the state of your customer experience? Consider that today’s consumers are loyal to the brands that personalize the experience, are instantly responsive to their needs, and are authentic in the way they deliver service. The more loyal those customers are, the more they buy.
With that in mind, it’s clear that the quality of your customer experience is directly correlated with Lifetime Customer Value. (We discussed the LCV metric in more depth in our recent blog post, The True Cost of Losing a Customer.)
When you focus on improving that metric, what you’re really doing is shifting your efforts to decrease churn rate and increase retention. In our blog post about the cost of losing a customer, we referenced the example of a client who worked with us to implement a 24/7 team of Subject Matter Experts in support of a customer who had threatened to leave after a disappointing experience. The increased effort to meet expectations and provide a better experience was highly successful. Not only did the client stick around for the long run, their continued business meant a higher lifetime value.
Data is the GPS Mapping Your Customer Experience
While Lifetime Customer Value is a critical measure of your customer experience, it can’t by itself tell you what to focus on in your efforts to improve it. That’s where you have to take a holistic approach with the underlying data.
For example, we can’t forget about Net Promoter Scores (NPS) and Customer Satisfaction (CSAT). NPS was a metric first introduced in 2003, which feels like a lifetime ago. But instead of growing obsolete, this metric has simply entered its wiser golden years. Asking a customer to rate the probability of their promoting your brand to friends and family is a highly effective way to measure how well each interaction is being handled. We are big fans of the “Willingness to Assist” (WTA) metric which we measure through post-contact surveys. WTA is an actionable coaching point for your agents and relates directly to the customer experience. Moving the bar on Willingness to Assist is almost always correlated to an increase in CSAT and/or NPS.
That said, it’s important to remember that most customers respond to an NPS or CSAT survey with one specific interaction in mind, which doesn’t necessarily reflect their big-picture perception of your brand or their lifetime loyalty as a customer. A high NPS score after one successful interaction doesn’t guarantee a customer won’t switch brands next month. Thus, NPS, CSAT, and other scores like Customer Effort Score (CES) are still only a fraction of the big picture when it comes to improving the end-to-end customer experience.
These metrics are most valuable when you can segment and filter them by type of customer (especially by tenure and lifetime value), type of interaction (related to the channel they use or teams they interact with), and the customer’s score over time. Comparing these metrics against data about buying habits, social media interactions, eCommerce activity and more will begin to give you the bigger picture. This is also where you get to add in those more elementary contact center metrics, like Average Handle Time, Average Speed to Answer, and First Call Response rates.
The key is to map out the data in alignment with the customer journey – even in the moments when they are not interacting with you – creating a picture of exactly how well you are serving a customer throughout the lifetime of their advocacy. How that data maps out for high-value customers will likely look very different than the map for short-term, low-value customers. The differences between the two will indicate areas where you can use the data to improve the customer experience in a way that increases the average lifetime customer value.
Sound complicated? It can be, but the time and energy invested into using your customer service data will be returned ten-fold in the value of your customers.
Need a hand? We’d love to chat about building a better customer experience by using the data at your fingertips. Contact us here.
Also, grab our latest eBook for more insight, Is a Strategic Contact Center Partnership Even Possible?
Read these related articles next:
The True Cost of Losing a Customer
Which 2019 Consumer Trends Will Impact Your Customer Experience Strategy?
Secrets to Incredible Customer Service with Paul R. Jones

![What You Need to Know When Looking for a New Contact Center Outsourcer [Slideshare]](https://blueocean.ca/wp-content/uploads/2017/07/What-You-Need-to-Know-When-Looking-for-a-New-Contact-Center-Outsourcer-150x150.png)

![The 10 Most Important Contact Center RFP Questions [Infographic]](https://blueocean.ca/wp-content/uploads/2019/09/Blue-Ocean-Blog-9-10-19-150x150.png)